US Births Analysis
Project Information
- Category: Data Analytics / Public Health / Demographics
- Client: Quantum Analytics(Intenship Project)
- Project Date: December 2023
- Tools Used: Power BI (Power Query, DAX)
- Data Source: CDC WONDER Natality Data (2016-2021)
- Project URL: View Live Dashboard (If available)
US Births Analysis: Trends by Year, State, and Mother's Education Level
Summary
This Power BI project provides an in-depth analysis of birth rates and related data across the 50 US states and DC from 2016 to 2021, sourced from the Centers for Disease Control and Prevention (CDC). The dashboard focuses on examining trends and patterns in birth rates, gender distribution, birth weight, and particularly emphasizes the influence of the mother's educational level. Through robust exploratory data analysis, the project aims to deliver actionable insights into demographic shifts, health outcomes, and the socio-economic factors influencing birth patterns in the United States, supporting public health researchers and policymakers.
1. Introduction: Understanding Birth Trends in the US
Birth data offers crucial insights into population dynamics, public health, and socio-economic factors. This project addresses the need for a comprehensive and accessible analysis of US birth trends from 2016 to 2021. Leveraging data from the CDC, the initiative focuses on dissecting birth rates by various dimensions, including state, year, baby's gender, and most notably, the educational attainment of the mother. The goal is to unveil significant patterns that can inform policy decisions, public health initiatives, and demographic studies.
2. Project Objectives & Goals
The core objectives for this Power BI project were defined to provide comprehensive insights into US birth patterns:
Overall Objectives:
- To perform robust exploratory analysis of US birth data to uncover significant trends and patterns.
- To provide actionable insights into the relationship between mother's education level and birth outcomes.
- To support researchers and policymakers with a clear, interactive platform for demographic and public health analysis.
Project Goals & Deliverables:
- Overall Birth Statistics Overview: Display key metrics such as Total Number of Births, Average Age of Mother, and Average Birth Weight across the dataset.
- Birth Trends Over Time: Visualize the total number of births annually from 2016 to 2021.
- Birth Distribution by State: Map or list births per state to identify high and low birth rate regions.
- Gender Distribution: Analyze the male-to-female birth ratio.
- Mother's Education Level Analysis: Show the number of births, average maternal age, and average birth weight across different educational attainment categories.
- State-Specific Trends: Allow filtering by state to examine localized birth patterns.
- Educational Impact on Birth Outcomes: Investigate how mother's education level correlates with average age at birth and average baby weight.
- Interactive Filtering: Enable dynamic filtering by Year, State, Gender, and Education Level of Mother for granular analysis.
3. Data Scope & Metrics
The analysis utilized a detailed dataset provided to me by Quantum Analytics, it was sourced from the CDC WONDER Natality page, covering birth data from 2016 to 2021 across all 50 states and the District of Columbia.
Data Source:
- CDC WONDER Natality Data (2016-2021): This dataset provides birth rates and related data across the 50 states and DC from 2016 to 2021. Each row represents a category defined by state, birth year, baby's gender, and mother's educational level.
- Column Descriptions:
- `State`: Full state name (includes District of Columbia)
- `State Abbreviation`: 2-character state abbreviation
- `Year`: 4-digit year
- `Gender`: Gender of baby
- `Education Level of Mother`: Categorized educational attainment of the mother
- `Education Level Code`: Corresponding code for education level
- `Number of Births`: Number of births for the category
- `Average Age of Mother (years)`: Mother's average age in the category
- `Average Birth Weight (g)`: Average birth weight in the category
- Important Note: Categories with less than ten births are suppressed. For this reason, 12 rows are missing out of an expected 5,508. These missing rows all had the mother's educational level listed as "unknown or not stated" and their absence should not significantly impact studies or conclusions.
- Column Descriptions:
Key Data Points & Metrics Captured and Displayed:
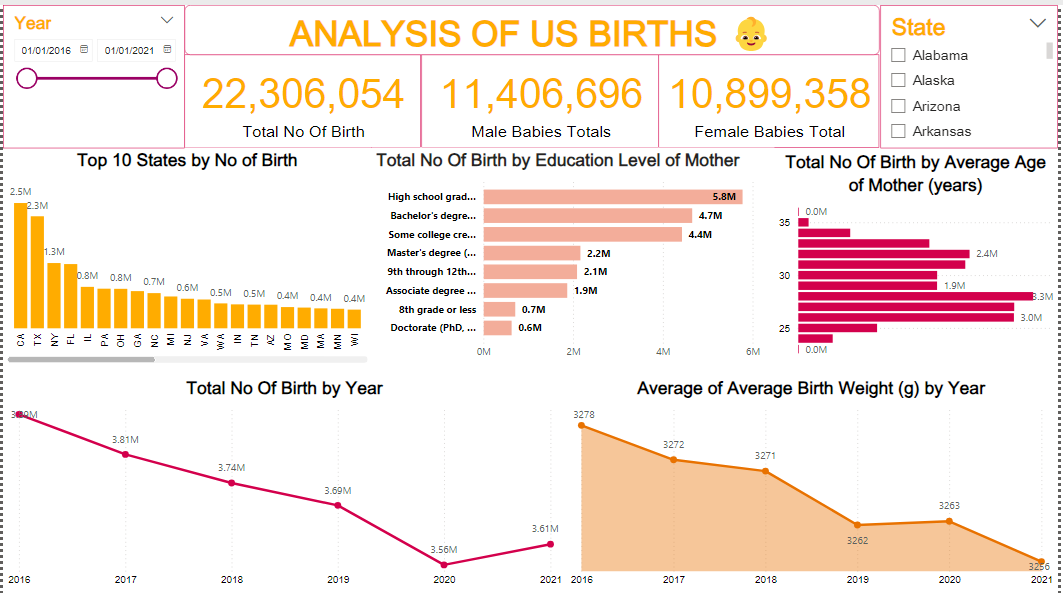
- Total No of Birth: 22,306,054
- Male Babies Totals: 11,406,696
- Female Babies Total: 10,899,358
- Top 10 States by No of Birth: TX (3.3M), CA (2.3M), FL (1.3M), NY (1.3M), IL (0.8M), OH (0.8M), GA (0.7M), NC (0.7M), MI (0.5M), NJ (0.5M)
- Total No of Birth by Education Level of Mother: High school graduate (5.8M), Bachelor's degree (4.7M), Some college credit but not a degree (4.4M), Master's degree (2.2M), 9th through 12th grade (2.1M), Associate degree (1.9M), 8th grade or less (0.7M), Doctorate (PhD, MD, DDS, etc.) (0.6M)
- Total No of Birth by Average Age of Mother (years): Highest numbers around average age 30 (3.0M), 2.4M at 2.4M, 1.9M at 1.9M.
- Total No of Birth by Year: 3.82M (2016), 3.74M (2017), 3.69M (2018), 3.56M (2019), 3.39M (2020), 3.61M (2021).
- Average of Average Birth Weight (g) by Year: Decreasing trend from 3278 (2016) to 3263 (2020) with a slight increase to 3267 (2021).
Key Insights Derived from Data (Pre-Dashboard):
- The total number of male babies (11.4M) is slightly higher than female babies (10.8M) over the period.
- Texas and California consistently show the highest number of births, indicating these are key demographic centers.
- There is a notable decreasing trend in total births from 2016 to 2020, with a slight rebound in 2021. This reflects broader national trends in declining birth rates.
- High school graduates account for the largest proportion of births (5.8M), followed by mothers with Bachelor's degrees (4.7M) and some college credit (4.4M). This suggests that while higher education is becoming more common, a significant portion of births still come from mothers with high school or some college education.
- The average age of mothers at birth appears to cluster around 25-35 years, with 30 years having the highest number of births.
- The average birth weight shows a slight decline over the years, which could warrant further investigation into health and environmental factors.
- The smallest number of births are from mothers with a Doctorate or Professional degree, which aligns with expected population distributions for higher education levels.
4. Dashboard Design & Key Insights (Based on Visual Analysis)
The "ANALYSIS OF US BIRTHS" dashboard is designed to provide an interactive and comprehensive view of birth data, highlighting trends and patterns across various dimensions.
Dashboard Features and Key Insights:
4.1 Executive Summary & Key Performance Indicators (KPIs)
The dashboard prominently displays key summary statistics at the top:
- Total No of Birth: 22,306,054
- Male Babies Totals: 11,406,696
- Female Babies Total: 10,899,358
These KPIs offer an immediate understanding of the overall scale and gender distribution of births.
4.2 Temporal and Geographical Trends
- Total No of Birth by Year (Line Chart): A line chart clearly illustrates a declining trend in total births from 3.82M in 2016 to 3.39M in 2020, with a slight increase to 3.61M in 2021. This visual emphasizes the broader demographic shift towards fewer births over the observed period.
- Average of Average Birth Weight (g) by Year (Area Chart): An area chart shows a slight decrease in average birth weight from 3278g in 2016 to 3262g in 2020, followed by a minor uptick to 3267g in 2021. This trend could prompt further investigation into public health factors.
- Top 10 States by No of Birth (Bar Chart): A bar chart highlights states like Texas (3.3M) and California (2.3M) as having significantly higher birth numbers compared to others like Michigan (0.5M) and Minnesota (0.4M). This identifies key regions contributing to national birth rates.
4.3 Educational Attainment and Maternal Age
- Total No of Birth by Education Level of Mother (Bar Chart): This horizontal bar chart reveals that mothers with "High school graduate" education account for the largest number of births (5.8M), followed by "Bachelor's degree" (4.7M) and "Some college credit" (4.4M). This provides insight into the educational background of mothers.
- Total No of Birth by Average Age of Mother (years) (Bar Chart): The chart shows a concentration of births for mothers with an average age around 25-35 years, with the highest bars representing around 3.0M births. This indicates the peak childbearing age range.
4.4 Interactive Filtering
- Year and State Slicers: Slicers at the top of the dashboard allow users to filter data by specific "Year" (from 2016 to 2021) and "State" (e.g., Alabama, Alaska, Arizona, Arkansas). This enables granular analysis and drilling down into specific timeframes or geographical regions.
The dashboard's clean layout and interactive elements empower public health officials, researchers, and policymakers to quickly grasp complex demographic patterns and generate data-driven hypotheses for further study.
5. Technical Approach & Tools
The project followed a robust data analysis and business intelligence workflow using Power BI:
- Data Acquisition & Ingestion: The CDC WONDER Natality dataset was imported into Power BI Desktop.
- Data Cleaning & Transformation (Power Query in Power BI): Power Query Editor was extensively used for data preparation:
- Handled the 12 missing rows (categories with <10 births) by acknowledging their absence ensuring this doesn't skew overall insights.
- Ensured data consistency and addressed any potential irregularities in categorical fields like `State`, `Gender`, and `Education Level of Mother`.
- Converted numerical fields (`Number of Births`, `Average Age of Mother (years)`, `Average Birth Weight (g)`) to appropriate data types to facilitate accurate calculations.
- Created new columns or transformed existing ones as needed for specific visualizations (e.g., ensuring `Year` is treated as a chronological dimension).
- DAX (Data Analysis Expressions) Calculations: DAX measures were created to compute key business metrics and aggregations:
- `Total No of Birth = SUM('US Births Analysis'[Number of Births])`
- `Male Babies Totals = SUMX(FILTER('US Births Analysis', 'US Births Analysis'[Gender] = "Male"), 'US Births Analysis'[Number of Births])`
- `Female Babies Total = SUMX(FILTER('US Births Analysis', 'US Births Analysis'[Gender] = "Female"), 'US Births Analysis'[Number of Births])`
- Measures for average maternal age and average birth weight by year and education level were also developed.
- Data Visualization & Dashboarding (Power BI Desktop): The dashboard was designed with a focus on clear and insightful representation:
- KPI Cards: Utilized for prominent display of total births, male totals, and female totals.
- Line Chart: To visualize birth trends over time.
- Bar Charts: Effectively compare births by education level, average age, and top states.
- Area Chart: For showing the trend of average birth weight by year.
- Slicers: Implemented for dynamic filtering by Year and State, enhancing user interactivity.
- Publishing & Sharing (Power BI Service): The final interactive report was published to the Power BI Service, enabling wider access and collaborative demographic analysis.
6. Impact & Business Value
This Power BI dashboard for US birth analysis delivers substantial value to public health organizations and researchers:
- Informed Public Health Policy: By clearly identifying birth trends and disparities related to maternal education, policymakers can develop targeted health programs, educational initiatives, and support systems.
- Enhanced Demographic Understanding: The analysis provides a comprehensive view of population shifts, crucial for urban planning, resource allocation, and forecasting future societal needs (e.g., schools, healthcare facilities).
- Identification of Health Disparities: Correlations between mother's education and birth outcomes (like average birth weight) can highlight areas requiring intervention to reduce health inequalities. For instance, if lower education levels consistently show lower average birth weights, it suggests a need for targeted maternal health support programs.
- Efficient Research Tool: The interactive dashboard serves as a dynamic tool for researchers to explore hypotheses, validate findings, and generate new questions about birth patterns and influencing factors.
- Data-Driven Decision Making: Provides government agencies and non-profits with accessible, real-time insights to make evidence-based decisions for maternal and child health.
- Proactive Resource Allocation: Understanding which states or educational groups have specific birth characteristics can help in allocating healthcare resources, educational support, and social services more effectively. The dashboard shows Texas and California as high birth states, indicating potential areas for increased maternal care resources.
- Baseline for Longitudinal Studies: The 2016-2021 data provides a robust baseline for future longitudinal studies on birth trends and the long-term impact of educational attainment.
7. Conclusion
This Power BI project successfully provides a critical analytical tool for understanding US birth trends by year, state, and mother's education level. By meticulously processing and visualizing the CDC Natality dataset, the dashboard offers clear, actionable insights into demographic shifts, health outcomes, and the socio-economic factors influencing birth patterns. The ability to filter and analyze data across various dimensions empowers public health researchers and policymakers to make data-driven decisions that will inform policy development, resource allocation, and targeted interventions aimed at improving maternal and child health outcomes across the United States. This analysis serves as a valuable resource for understanding the complex dynamics of birth in modern society.